
Dashboard
Your whole fleet at a glance.
The Dashboard is the first screen you see. It answers one question: is everything fine right now?
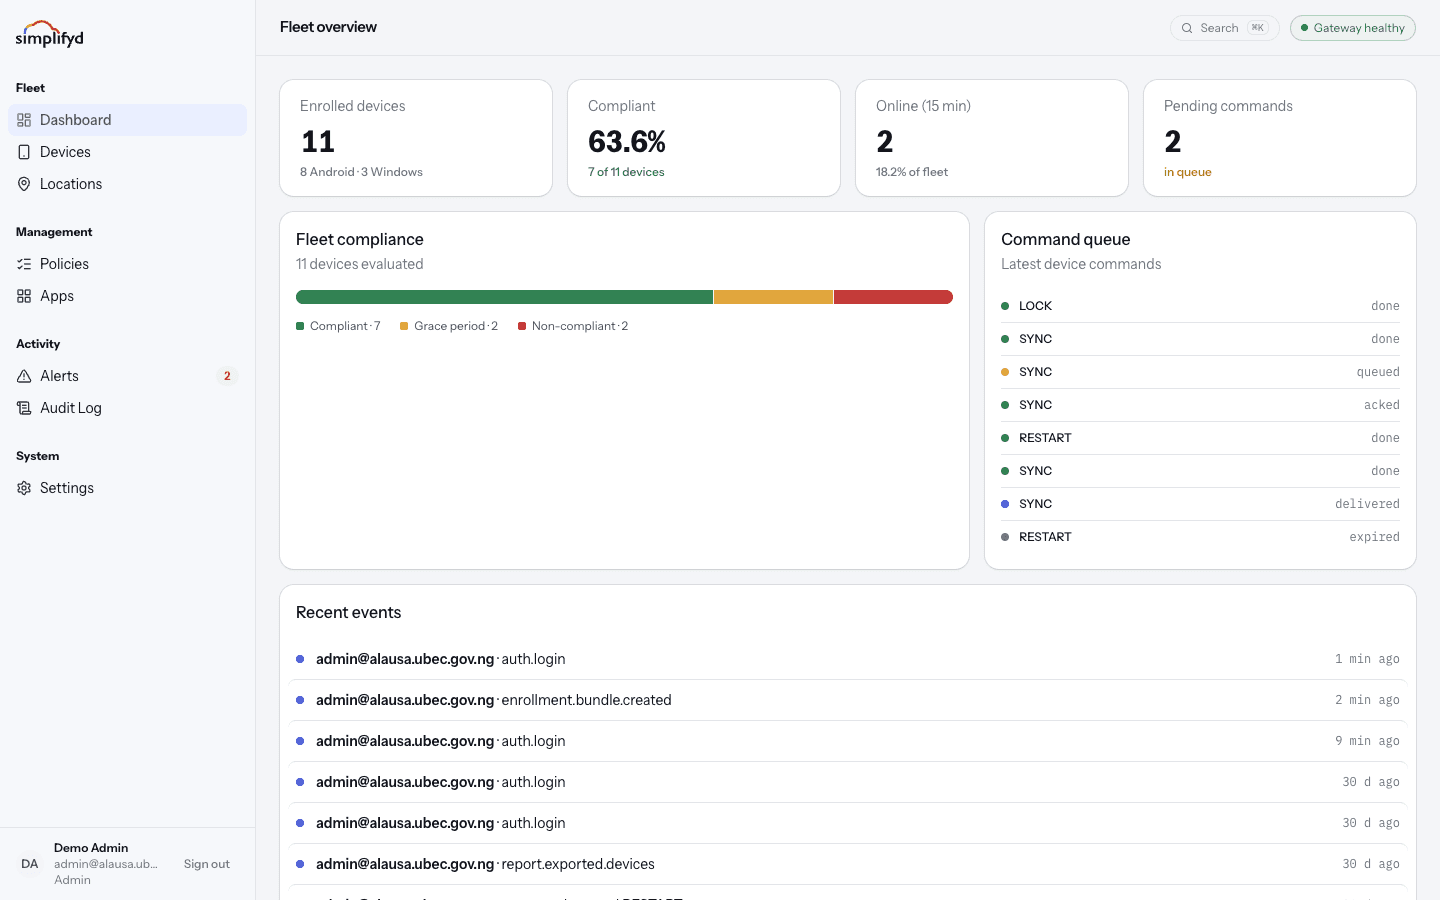
The four numbers at the top
| Tile | What it tells you |
|---|---|
| Enrolled devices | How many devices you manage in total. |
| Online (15 min) | How many have checked in during the last 15 minutes. |
| Compliant | How many are following all their rules. |
| Pending commands | Instructions you have sent that devices have not carried out yet. |
A healthy fleet has Online close to Enrolled during working hours, Compliant close to Enrolled, and Pending commands near zero.
Fleet compliance
A breakdown of your devices by compliance state:
- Compliant — following every rule in its policy.
- Grace period — something is wrong, but the device still has time to fix it before it counts as a failure.
- Non-compliant — breaking a rule now and needs attention.
Select through to Alerts to see exactly what is wrong.
Command queue
Recent instructions sent to devices and how far along they are. A command moves through these stages:
Queued → Sent → Delivered → Acknowledged → Done
If it cannot be carried out it ends as Failed, and if the device never picked it up in time it ends as Expired. Both are safe to try again.
Recent events
The newest entries from the audit log — who signed in, who changed a policy, who sent a wipe. Use it as a quick "what happened while I was away". The full history lives in the Audit log.
What to check each morning
- Is Online far below Enrolled? Some devices are switched off, out of signal, or stuck. Check Alerts for the "Silent 24h+" filter.
- Are there non-compliant devices? Work through them.
- Are commands stuck in Queued? The device has not checked in yet — see Device is not checking in.